In one of our earlier articles, we covered a major use case for our PUMP 2.0 social media analytics platform - “Catching the Amplification”. In this article, we continue to explore the essential applications of PUMP 2.0, delving into another critical use case – social sentiment time series analysis.
Social Media Sentiment Time Series in PUMP 2.0
A major functionality of PUMP 2.0 is the ability to quantify asset-specific social media conversations into bullish, bearish, and neutral signals. For many financial assets, the platform provides a history of the quantified social media signals that goes back a full 5 years – a stretch of time that allows for quite in-depth time series analysis.
Using time series of social sentiment data, investors, fund managers, and analysts can track bearish and bullish signals for specific assets to observe changes and patterns occurring over time. The bearish and bullish sentiment measures aren’t the only ones available for time series analysis. We have developed a set of additional sentiment indicators for more granular measurement. These include derived measures such as dominating sentiment and scaled dominating sentiment.
These derived measures are based on the basic bearish and bullish sentiment metrics and feature a higher degree of predictive power than the simple indicators they are based on.
Additionally, PUMP 2.0 allows you to apply a number of functions to the sentiment time series. These include moving averages, exponential moving averages, and Kaufman moving averages.
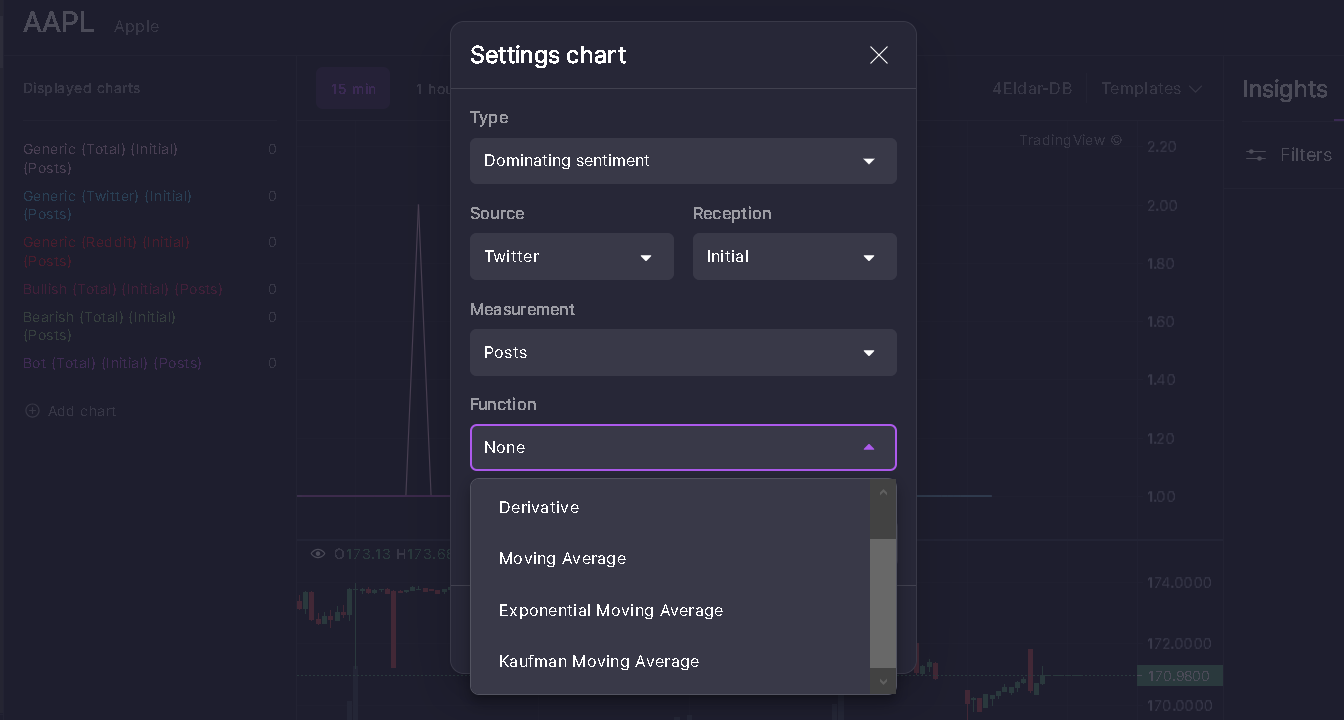
The settings screen of PUMP 2.0 for social sentiment charts
Social sentiment data in the form of time series in PUMP 2.0 includes indicators like posts, comments, likes, comments, reposts, post views, and the total audience reach. For example, you may track Bitcoin’s bullish, bearish, or dominating sentiment over the last one year based on social media comments and observe changes and trends over time.
Time Series Use Cases in PUMP 2.0
Quantifying and presenting sentiment data as time series opens up a number of opportunities for the users of our platform. Below, we list some of the more useful applications of PUMP 2.0 times series data:
1. Using sentiment time series as an input for quantitative models
Hedge funds, analysts, and quantitatively-minded investors use a number of quant models to predict market developments and asset prices. Most of this data comes from technical indicators, such as past prices and trading volumes, and a variety of additional inputs. Social sentiment time series can be one of these additional inputs into the quantitative models to improve their accuracy.
The social sentiment time series is a vastly different type of input from the traditional metrics used in these models. Including a variable that comes from a totally different domain of measurement can help the quantitative trading models achieve that edge over the rest of the market.
2. Developing custom trend and pattern analysis techniques
As users get more proficient with PUMP 2.0, sentiment time series data can help the analytically-minded develop their own trend and pattern analysis techniques. These techniques can then enhance investment decisions and forecasts.
For instance, using time series for a specific asset, you might observe certain sentiment patterns that are highly predictive of the asset’s future price moves. While there are some asset-agnostic predictive measures in PUMP 2.0 – e.g., the dominating sentiment measure is frequently predictive of future returns for most assets – there are also asset-specific, more nuanced patterns that can only be discovered after tracking the specific assets for a period of time.
3. Monitoring for IPOs
Many companies are actively promoting their brands before IPOs, including running social media campaigns. These often start months before the planned IPO. Monitoring for social signals over time via analysing time series can help users of PUMP 2.0 spot sentiment buildup for promising yet-to-be-listed companies.
The ability to identify promising companies at the early stages of pre-IPO promotions on social media can be valuable for hedge funds and investors on the lookout for such opportunities.
4. Correlating sentiment time series data and price data
Tracking and plotting time series data and the associated price data for a variety of financial assets can provide valuable insights. The time series data provided by PUMP 2.0 comes with the price data integrated on the same chart. This helps users spot the association between sentiment signals and prices.
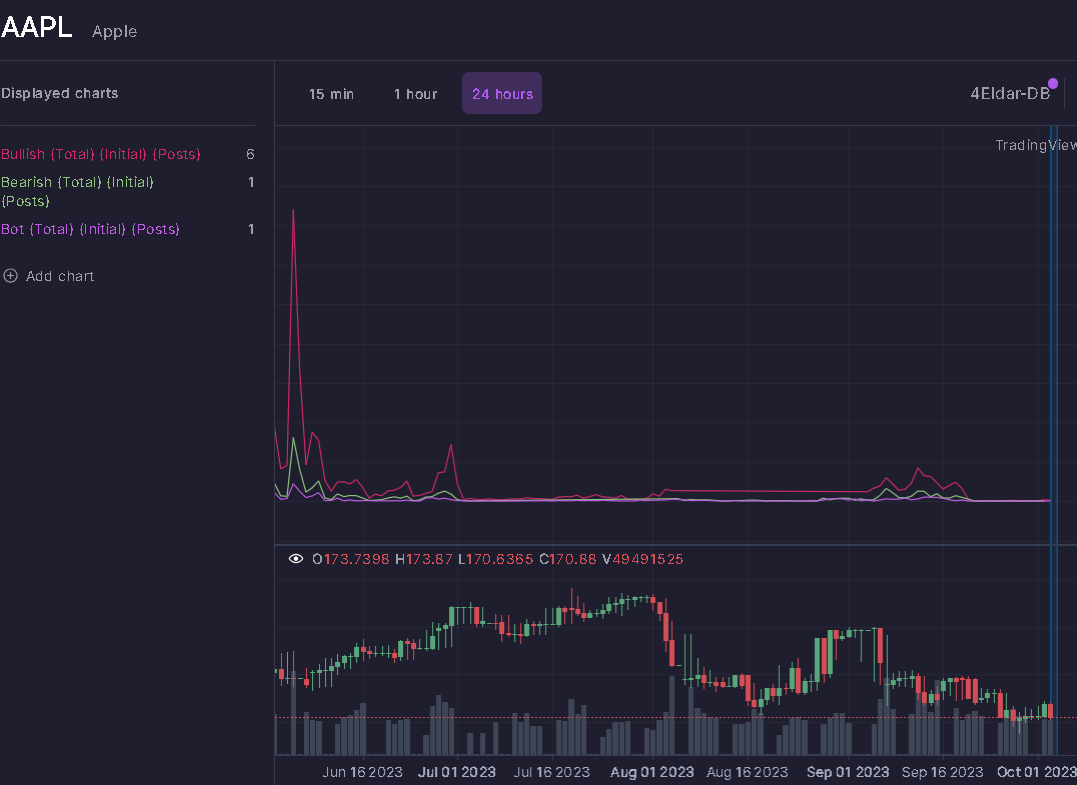
An example chart from PUMP 2.0 showing sentiment measures and prices over time
5. Portfolio asset monitoring
PUMP 2.0 sentiment time series is useful not only to identify new assets to invest in but also to monitor the existing assets in your portfolio. Sentiment developments over the medium and long term provide early warning signals if the assets in your portfolio experience any sentiment deterioration. This can be used as a risk management measure for portfolio monitoring.
The use cases covered above are only the most common applications for sentiment time series. As a user of PUMP 2.0, you can further develop your own custom modeling and monitoring techniques peculiar to your investment style and target assets. The key role of PUMP 2.0 here is to provide you with an accurate and robust way of measuring such sentiment developments over shorter or more extended periods of time.