Sector-based investment forms an important part of strategy at a wide variety of hedge funds, mutual funds, and other investment entities. The issue of sector-based returns is the central point for such strategies. We have analysed a wide variety of different industry sectors and their recent historical returns to identify niches that deliver the best and the poorest ROI. Here are the results of our analysis.
Our Methodology
We have chosen 25 different sectoral verticals, both popular ones, such as technology and banking, and more specialised ones, such as materials and gold mining. As the key gauge of each sector’s performance, we used the major sectoral ETF returns. ETFs are an ideal product to evaluate sector-wide performance. Within each sector, there are select ETFs that focus on the most important stocks for the sector as well as achieving the most representative coverage.
These ETFs normally track an index, or a composition of indices, that acts as the main proxy for the performance of that specific niche. We have analysed monthly returns for the selected 25 sectoral ETFs over several time periods to early August 2023 – 10 years, 3 years, and 1 year. The 10-year data can act as a good representative gauge of the sector’s long-term performance. Such a period allows for estimates that smooth out temporary but major impactful events, e.g., COVID-19 or a period of unusual market volatility. The 10-year estimates are capable of giving a picture of the sector’s overarching potential, irrespective of such temporary major events.
The 3-year estimates help identify long-term potential in a more recent setting. While they might be affected by big, impactful events, their advantage over the 10-year data is recency and a better indication of the sector’s performance in the new, changing world of financial markets.
Finally, the 1-year estimates are helpful to form an understanding of the sector’s immediate performance right now and going into the future. The 1-year data might be less conclusive than the 10-year and 3-year figures, but it still helps identify signals of a previously successful niche that has started to crumble due to the most recent market developments.
The Best and Worst Performing Sectors – 10 Years (2013 to 2023)
Best Performers
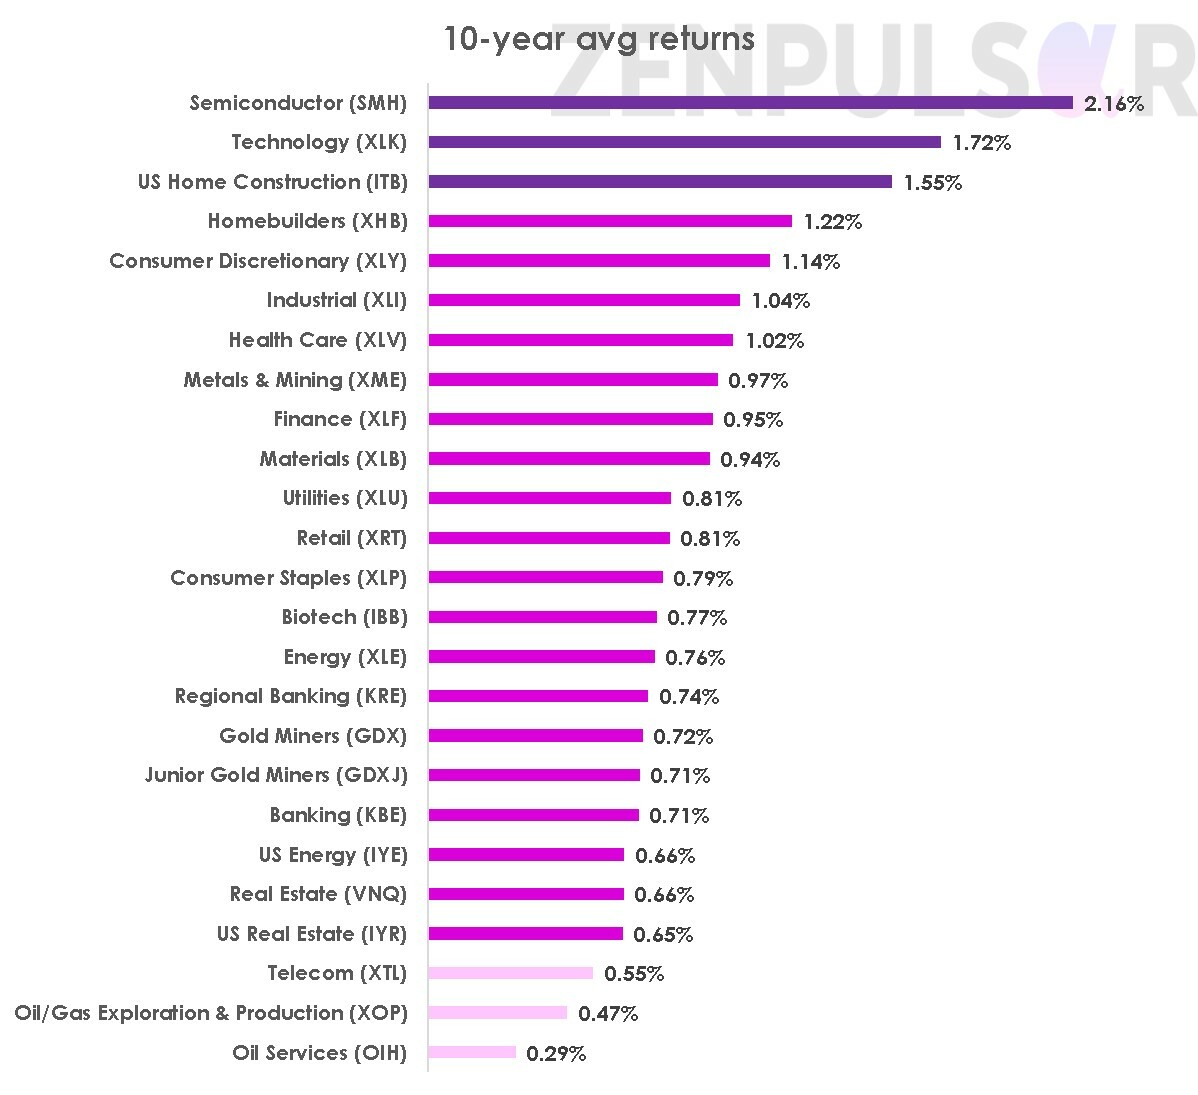
Based on the average of the last 10-year (August 2013 to August 2023) monthly returns, these sectors have done the best:
1. Semiconductor: average monthly returns of 2.16%
2. Technology: average monthly returns of 1.72%
3. US Home Construction: average monthly returns of 1.55%
The semiconductor industry’s record-setting 2.16% monthly returns work out to over 25% yearly returns, and that’s over the entire 10-year period, a performance level that even very high-risk financial instruments like derivatives would consider excellent. While the 2nd placed technology sector has also been in the spotlight over these years, the 3rd place occupied by the unassuming US Home Construction is worth a special note.
Worst Performers
Telecom and Oil&Gas have done worse than the rest over the 10-year period. The three worst performers over this period based on monthly returns are:
1. Oil Services: 0.29%
2. Oil & Gas Exploration & Production: 0.47%
3. Telecom: 0.55%
Below is a chart showing average monthly returns over the 10-year period for all 25 industry sectors in our analysis. The sector ETFs whose returns we based our figures on are shown in brackets.


The Best and Worst Performing Sectors – 3 Years (2020 to 2023)

Best Performers
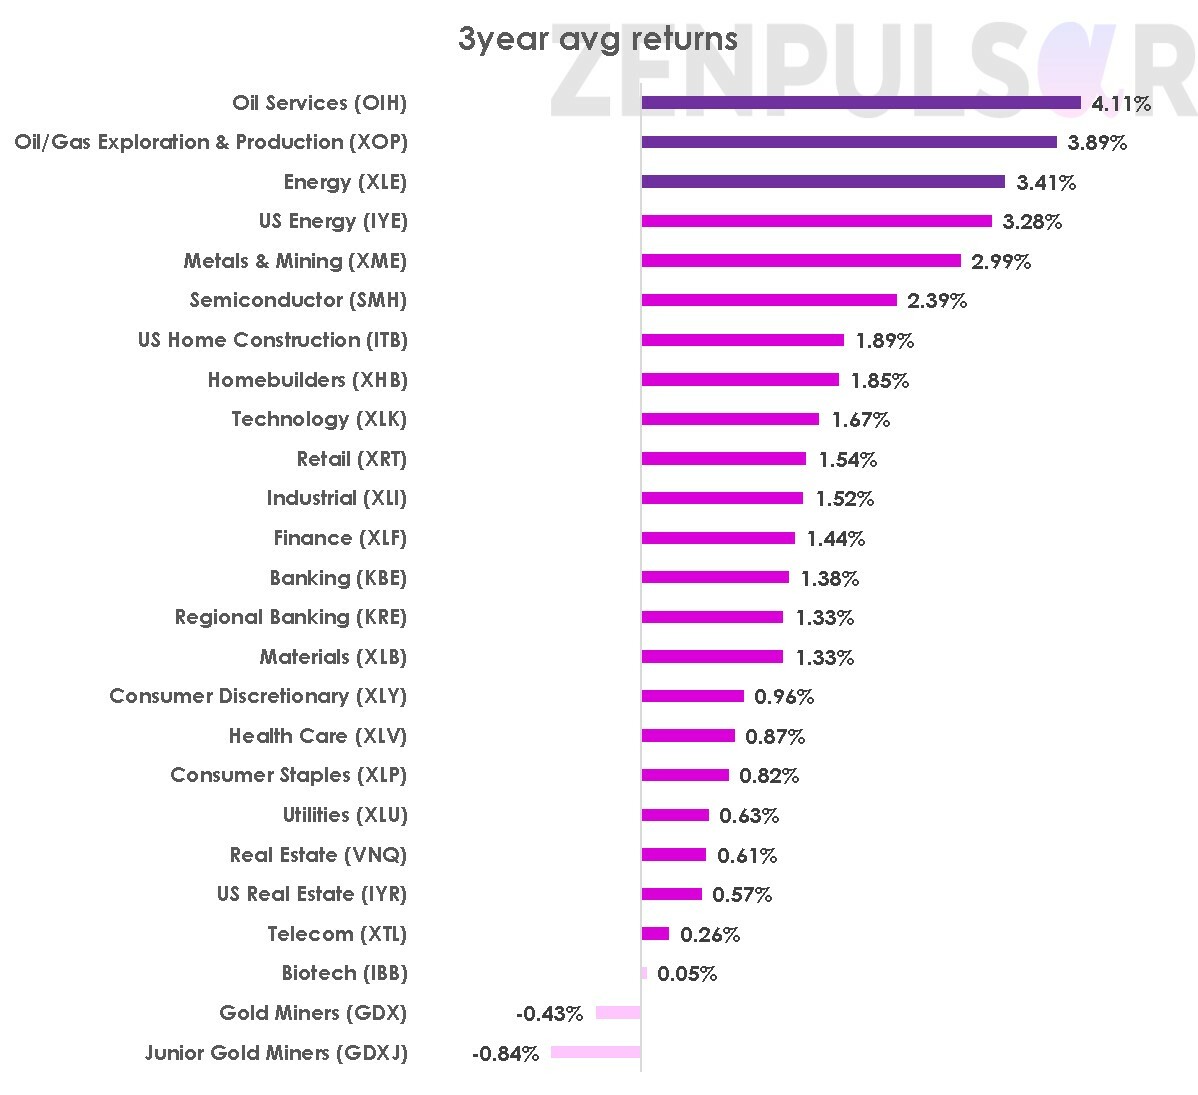
While the Oil&Gas sector has done poorly over the entire 10-year period, the niche’s fortunes have seen a turnaround over the last 3 years, undoubtedly due to the recent big, tectonic events – COVID-19 and the war in Ukraine. The best performing sectors based on monthly returns over the 3-year period between mid-2020 and mid-2023 have been:
1. Oil Services: 4.11%
2. Oil&Gas Exploration & Production: 3.89%
3. Energy: 3.41%
Worst Performers
In the 3-year period, the gold mining sectors have suffered the worst. The three worst sectors over this period have been:
1. Junior Gold Miners: - 0.84%
2. Gold Miners: - 0.43%
3. Biotech: 0.05%
Here are all 25 sectors and their average monthly returns over the last 3 years.


The Best and Worst Performing Sectors – 1 Year (2022 to 2023)
Best Performers
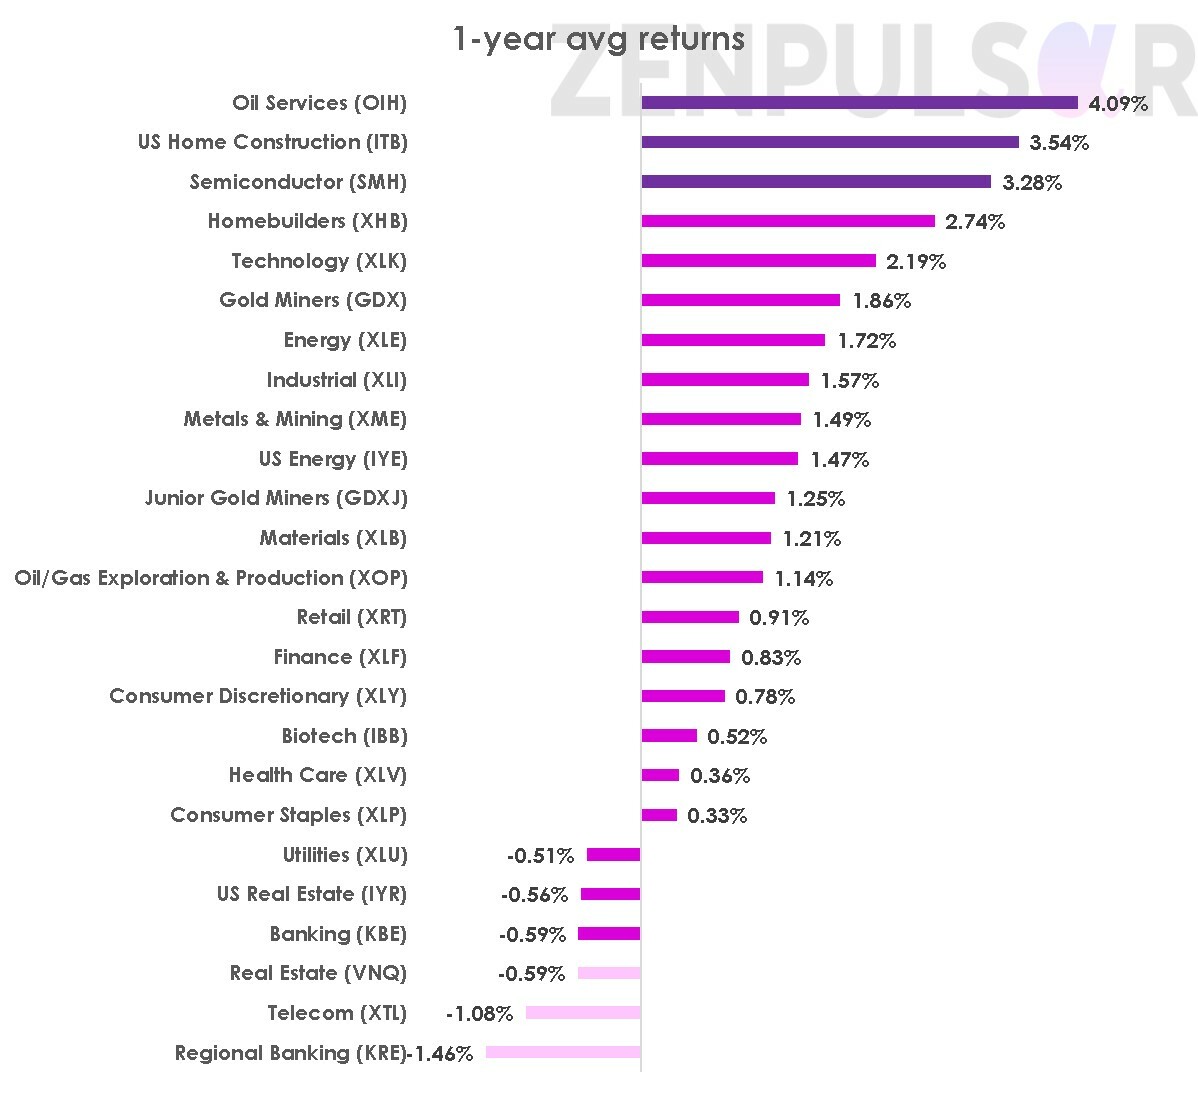
Based on the last one year, Oil Services, US Home Construction, and Semiconductor are the industries that have done well. Naturally, the shorter-term nature of this analysis period calls for treating these results with a degree of caution. Over this most recent period, the top 3 sectors have achieved the following average monthly returns:
1. Oil Services: 4.09%
2. US Home Construction: 3.54%
3. Semiconductor: 3.28%
Worst Performers
These sectors have done the worst over the last one year:
1. Regional Banking: - 1.46%
2. Telecom: - 1.08%
3. Real Estate: -0.59%
Below are the monthly returns over the last year for all the 25 analysed sectors.


Overall, the results point to two sectors doing better than the rest – Semiconductor and US Home Construction. Besides this duo, the Oil&Gas niches have also done exceedingly well in the more recent periods – 1 year and 3 years. However, these niches’ fortunes might be very dependent on the current and recent investment climates. Big international events, such as the COVID-19 pandemic and the war in Ukraine, can influence this sector massively. Before these major events, when the world markets didn’t have to deal with such “cataclysms”, the Oil&Gas niches had done very poorly.
We hope this analysis provides a useful cross-sectoral overview for investors focusing on sector-based strategies. Stay tuned for our further coverage on this topic.

